Written by Field Name
Report Date
5 min read

• Scientists tell us biodiversity is being lost at an alarming rate.
• A new Global Biodiversity Framework, along with new targets, is an expected result of the Convention on Biological Diversity’s COP15, the biodiversity equivalent of the IPCC’s COP26.
• Proposed targets include those related to the role of business. “All businesses (public and private, large, medium and small) assess and report on their dependencies and impacts on biodiversity, from local to global, and progressively reduce negative impacts, by at least half and increase positive impacts, reducing biodiversity-related risks to businesses and moving towards the full sustainability of extraction and production practices, sourcing and supply chains, and use and disposal.”(Target 15)
• Assessing biodiversity-related risks along a value chain requires a new metric and method.
• Fair Supply has launched a planet-first capability: extinction-risk footprinting. Companies can map their impact on species extinctions along the length of their supply chain. This capability is the fruitof the pioneering work of Sydney University Ph D candidate Amanda Irwin, Head of ESG Research at Fair Supply.
• Extinction-risk footprinting builds out Fair Supply’s suite of ESG risk assessment offerings which include modern slavery, scope 3 GHG emissions, land and water usage footprinting.
Biodiversity is defined by the Convention on Biological Diversity (CBD) as the “variability among living organisations from all sources including, inter alia, terrestrial, marine and other aquatic ecosystems and the ecological complexes of which they are part: this includes diversity within species, between species and of ecosystems.”
The Global Assessment Report on Biodiversity and Ecosystem Services, published by the Intergovernmental Science-Policy Platform on Biodiversity and Ecosystem Services (IPBES) in 2019, notes that “the great majority of indicators of ecosystems and biodiversity [are] showing rapid decline” (p. XV). This report highlights the global rate of species extinction, which is at least 10-100 times greater than the average over the last 10 million years. Projections show that loss of biodiversity is likely to continue without significant interventions, with up to 1 million species already threatened with extinction.
Human activity threatens biodiversity in two ways. The first, direct activity, is relatively easy to connect to its impact on biodiversity, and includes habitat loss and degradation, the introduction of invasive species, and the concentration of cultivation and trade on fewer plant and animal species. The second, activity which creates an indirect impact on biodiversity, similar to scope 3 carbon emissions, is much harder to quantify and to connect to the direct impact.
The Convention on Biological Diversity is currently developing the Global Biodiversity Framework (GBF), which will be the key discussion point at the 15th Conference of the Parties in 2022. This framework will be the successor to the current Strategic Plan for Biodiversity and its Aichi targets, developed in 2010 and widely considered to not have been met.

Apart from the obvious reason that biodiversity underpins everything that we humans need to be able to function, all the products and services that your organisation relies on and produces are ultimately sourced from the natural world.
An estimated US$44 trillion of economic value generation – more than half the world’s total GDP – is considered moderately or highly dependent on nature and its services.
The Network for Greening the Financial System (NGFS) state in their 2022 Occasional Paper, Central banking and supervision in the biosphere: “Biodiversity loss could have significant macroeconomic implications. Failure to account for, mitigate, and adapt to these implications is a source of risks relevant for financial stability.”
Just like climate-related risk assessments, it is important to understand the risks to your operations from further biodiversity loss. Questions to consider include:
• Which raw materials are essential to your business?
• In which locations do your operations directly rely on ecosystem services such as clean water, clean air, or pollination?
• What contingency plans do you have in place if those raw materials are unavailable, or the ecosystem services are impacted?
• At which points in your supply chains do vulnerabilities related to biodiversity loss exist?
Changes in the regulatory space are also expected to emerge over the coming years, similar to those now established in related ESG areas such as modern slavery and carbon emissions. It is likely that even organisations with very little operational risk from biodiversity loss will be expected to assess and report on their impacts on biodiversity.
Globally, the legislative environment in relation to biodiversity is also changing, as demonstrated by the recent Environment Act 2021 in the UK, which includes a provision for demonstration of net biodiversity gain to be a condition of planning permission, and in Italy where protection of the environment, biodiversity, and ecosystem was recently built into the Constitution. Significantly, in March 2022, the Task Force on Nature-related Financial Disclosures (TNFD) released the first beta version of its prototype risk management and opportunity disclosure framework.
“All businesses (public and private, large, medium and small) assess and report on their dependencies and impacts on biodiversity, from local to global, and progressively reduce negative impacts, by at least half and increase positive impacts, reducing biodiversity- related risks to businesses and moving towards the full sustainability of extraction and production practices, sourcing and supply chains, and use and disposal.” Target 15 of the draft Global Biodiversity Framework
Extinction risk is often generated by consumption decisions that occur far from the geographical location of species’ impacts. To footprint that risk - that is, to assess the impact of a value chain - requires a methodology that connects each transaction within a supply chain to every other transaction and a metric that quantifies the impact of these transactions.
Fair Supply’s brand new extinction-risk footprinting offering has solved this puzzle.
The new offering is the brainchild of Amanda Irwin’s pioneering research published in her doctoral thesis and in Nature: Scientific Reports. Ms Irwin is Head of ESG Research at Fair Supply.
Fair Supply have meshed the extinction-risk metric into its proprietary Integrated Assessment Engine, a supply chain risk assessment framework. The result is visibility of extinction risk impact along a company’s entire value chain to Tier 10 and beyond. Extinction-risk footprinting builds out Fair Supply’s suite of ESG risk assessment offerings which include modern slavery, scope 3 GHG emissions, land and water usage footprinting.
The challenges associated with developing extinction-risk footprinting were significant. They started with creating the right metric. Previous biodiversity footprinting metrics had, for the most part, focused on land use data. These land-use footprints, though useful, have been shown to be insufficient in generating global footprint assessments.
The metric had to be generated at an appropriate resolution to connect with consumption data. It had to be additive and independent. And the underlying data source needed to be reliable and consistently available.
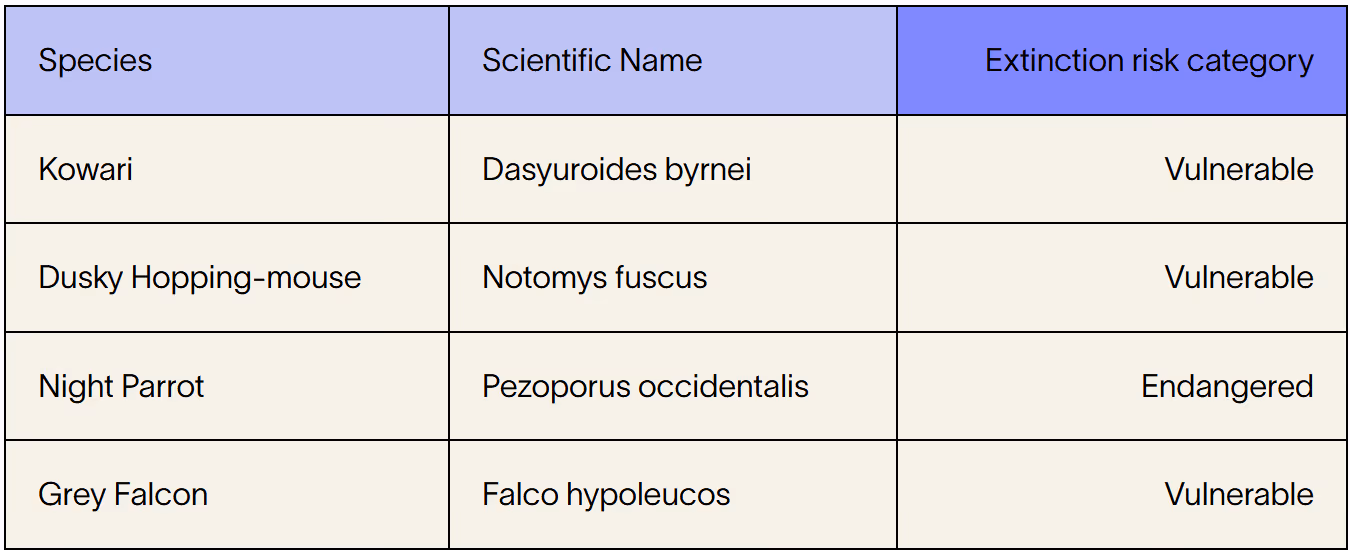
Ms Irwin turned to species vulnerability and the IUCN Red List and adopted the extinction risk of species as a quantifiable representation of biodiversity loss.
The International Union for Conservation of Nature (IUCN) Red List of Threatened species is the global authority on the conservation status of animal, fungi and plant species. This dataset contains detailed information on more than 134,000 species. Each species is assigned an extinction risk category based on an expert assessment. Importantly, the IUCN Red List also contains information on the nature of the threats to each species. Habitat maps provide spatial information which rounds out the information required to connect species impacts to consumption patterns.
The information curated in the IUCN Red List was used to generate the non-normalised Species Threat Abatement and Restoration (nSTAR) metric. This unit-less metric converts the extinction risk classification of each species, and the scope and severity of the threats acting on it, into a numeric value which provides an indicator of how likely that species is to move closer to extinction. The nSTAR value for each species, economic sector, and country can be calculated, providing the underlying metric for use with Fair Supply’s Integrated Assessment Engine.
Biodiversity loss, specifically species extinction risk, can be found at the location of direct operations for some organisations, but is also hidden deep within the supply chains of all entities. Our Integrated Assessment Engine quantifies extinction risk within supply chains to identify the locations and species most impacted by each industry.
We can identify the species most at risk from your on-the-ground operations and suggest potential interventions to mitigate the threats acting on those species.
Goyder Lagoon
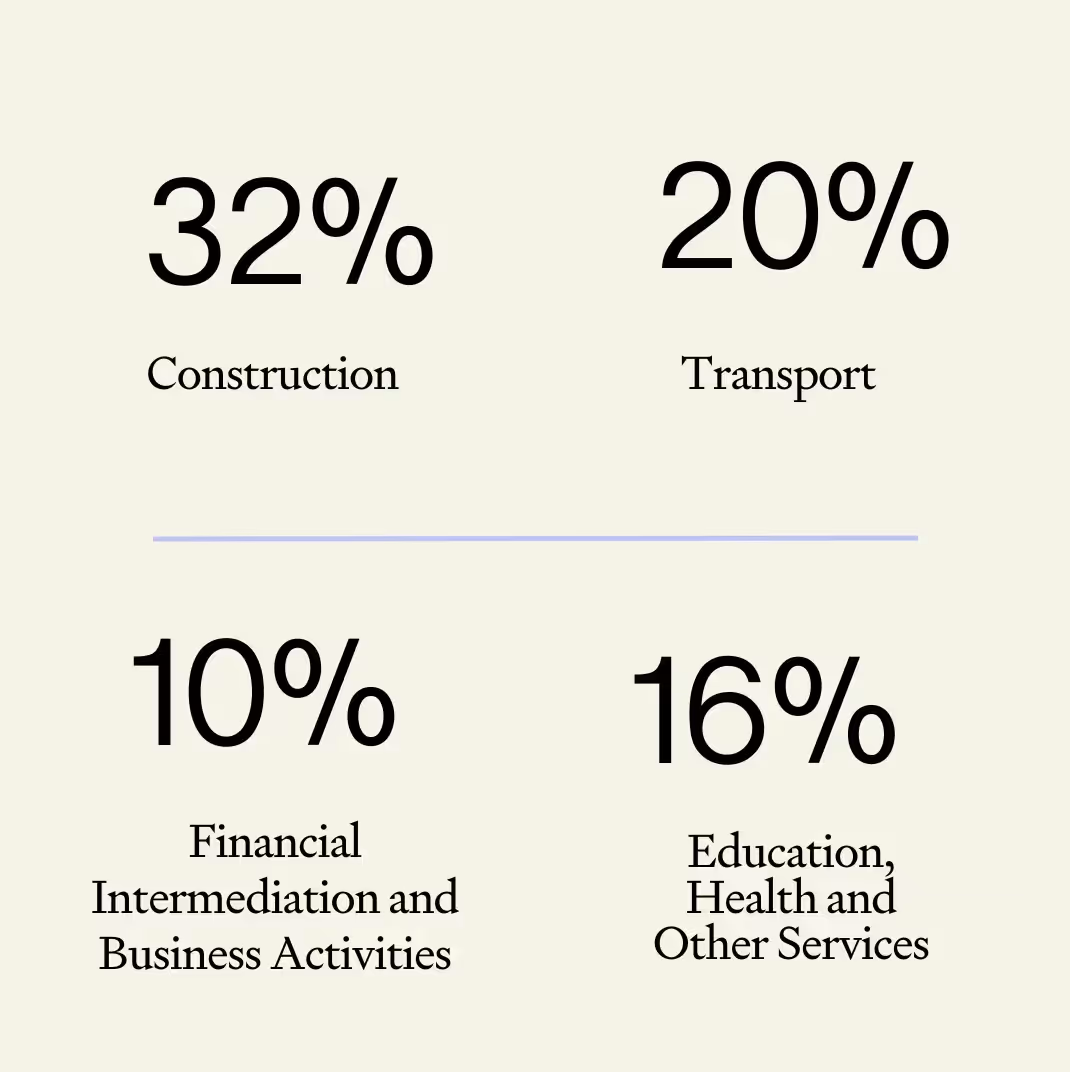
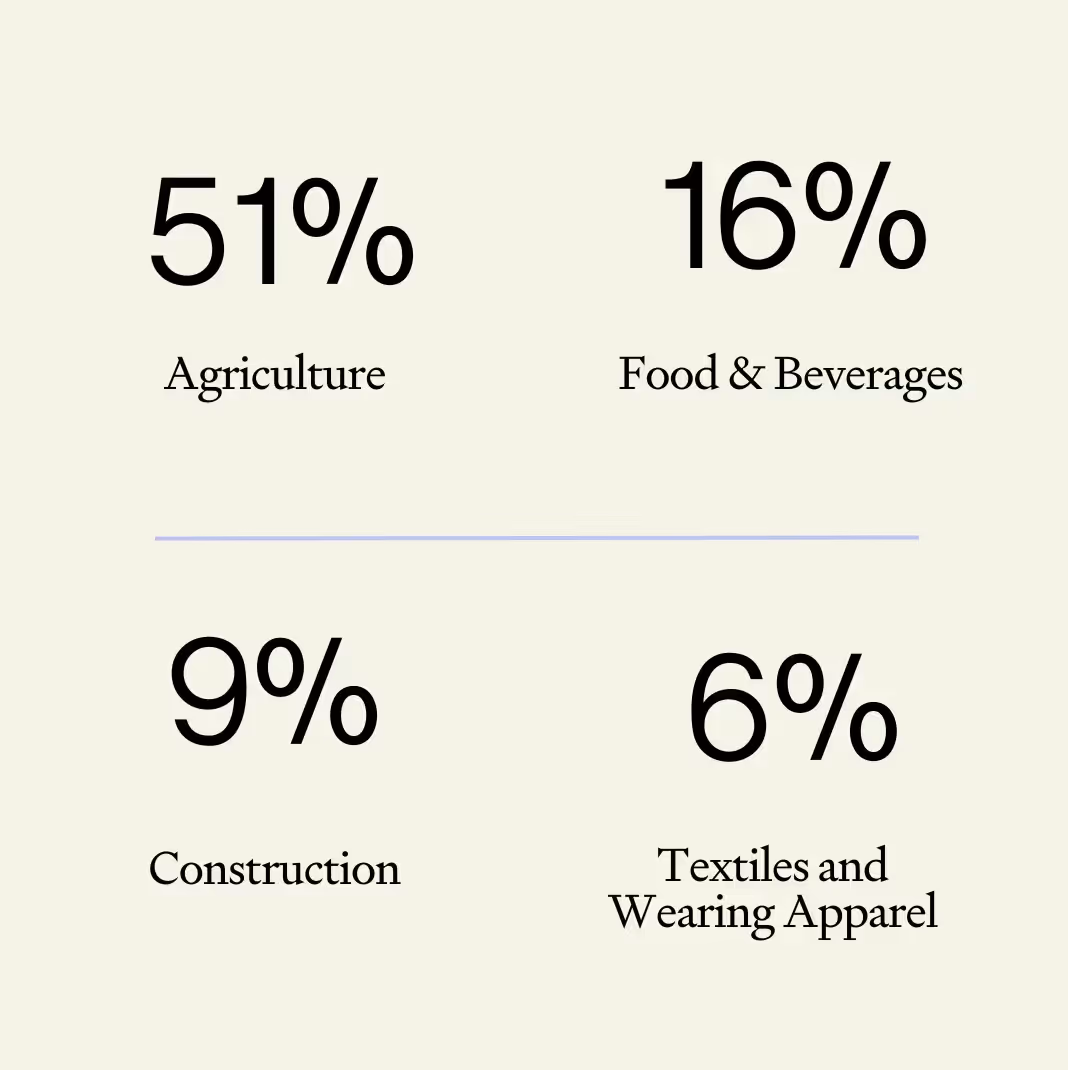
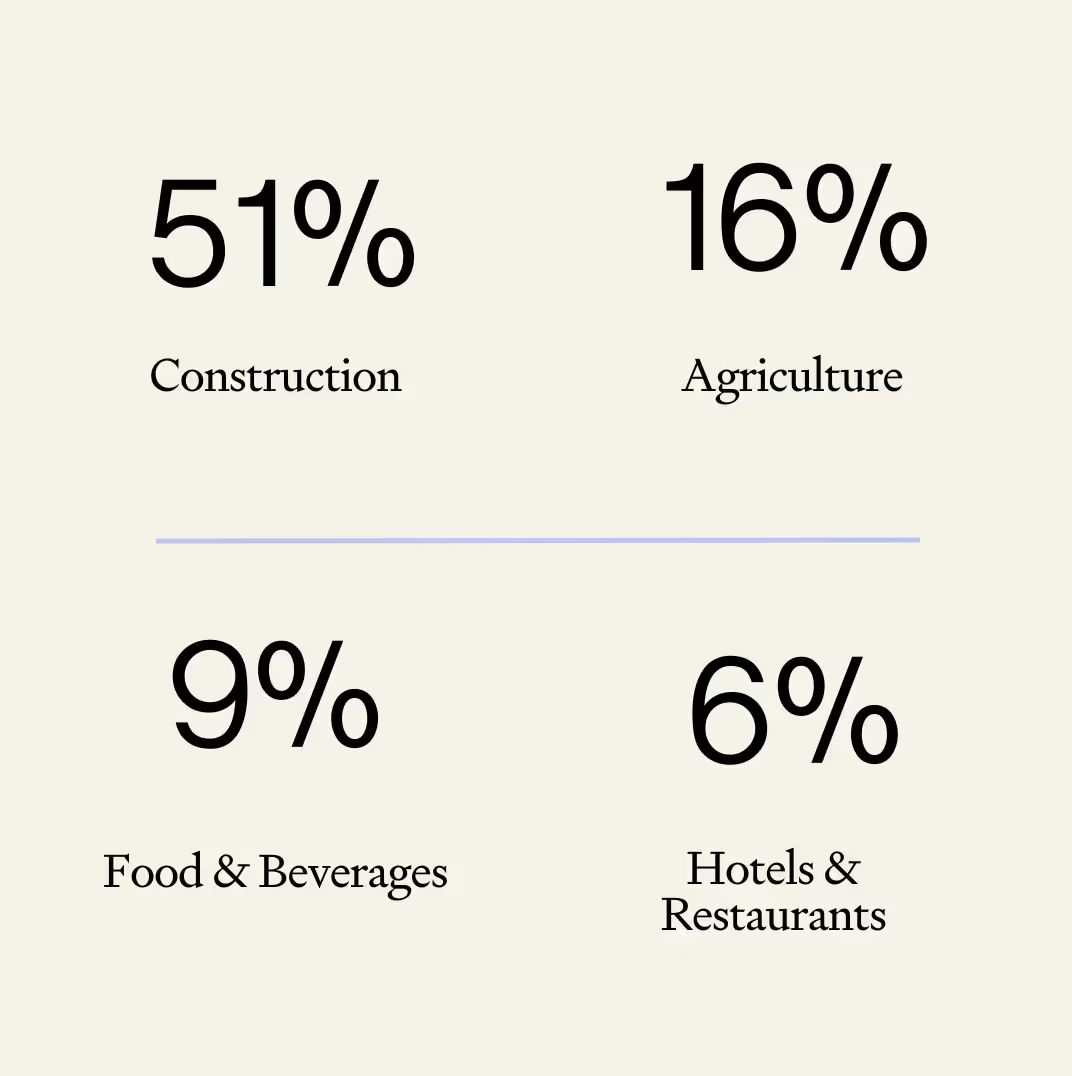
The power of extinction-risk footprinting by global sector lies in the capacity to understand how direct threats to species are fuelled by consumption in sectors, that, at a first glance, appear far removed.
Three examples are provided: the Koala, the Giant Panda, the Australian Painted Snipe.

• Residential & commercial development
• Transportation & service corridors
• Biological resource use
• Natural system modifications
• Climate change & severe weather
• Invasive and other problematic species, genes & diseases

• Residential & commercial development
• Agriculture & aquaculture
• Energy production & mining
• Transportation & service corridors
• Biological resource use
• Human intrusions & disturbance
• Natural system modifications
• Pollution
• Geological events
• Climate change & severe weather

• Agriculture & aquaculture
• Natural systems modifications
• Invasive and other problematic species, genes & diseases
This Report is prepared by Fair Supply Analytics Pty Limited.
ACN 637 115 587 (FairSupply)
1.1 FairSupply is not a financial or legal adviser and we have not considered any accounting, commercial, technical, operational, tax or financial matters. The information contained in the Report is not financial product or legal advice and does not consider your investment objectives, financial situation and particular needs (including financial, accounting, legal and tax issues).
1.2 Before acting on any information provided by FairSupply in this Report or in the Report Content, you should obtain independent professional advice and consider the appropriateness of the advice for you, having regard to your own circumstances.
1.3 FairSupply has used its best endeavours to ensure all information in this Report are correct and up-to-date at the time of publication. FairSupply, its officers, employees and agents do not make any representations or warranties (express or implied) as to the fairness, currency, accuracy, adequacy, completeness or reliability of the Report Content or that the Report is free from any errors, omissions or defects. FairSupply, its officers, employees and agents are not liable to you for any indirect, incidental, special or consequential loss or damage, loss of profits or anticipated profits, economic loss, loss of business opportunity, loss of data, loss of reputation or loss of revenue (irrespective of whether the loss or damage is caused by or relates to breach of contract, tort (including negligence), statute or otherwise, arising out of or in connection with the Report, the Report Content or all links in the Report, including (but not limited to) for any person placing any reliance on, or acting on the basis of the Report Content.
Learn more about our ESG risk and compliance platform or get in touch with an ESG specialist today